2025 · Master’s project · Data engineering · Machine learning · Behavioral science
Safe Biking in Paris
Paris wants to be 100% cyclable, but biking isn't always safe. This project asks what makes a cyclist's injury severe, and which light-touch interventions could make riding safer without discouraging it.
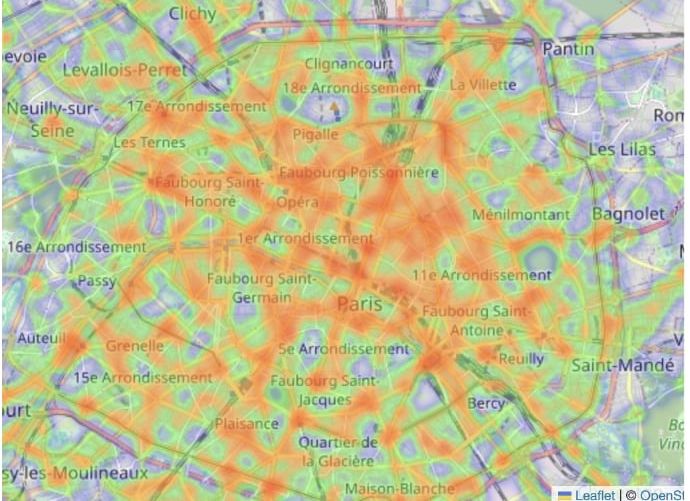
The data
France publishes every injury road accident each year on data.gouv.fr: around 50,000 accidents a year, split into four linked tables covering the circumstances, the location, the vehicles and the people involved. I used 2019 to 2023.
The pipeline
Five Docker containers run in order, so anyone with Docker and a Google Cloud key can reproduce the whole analysis with make setup, make build and make up. When a new year of data is published, the same commands pick it up.
infraTerraform creates the Cloud Storage bucket and BigQuery dataset as code, so the setup can be rebuilt or torn down in one command.ingestionPython downloads each year’s files from data.gouv.fr using a small manifest, and only fetches what is new.transformationdbt turns four raw tables into a star schema: staging models, one fact table with a row per person per accident, and marts for analysis, machine learning and bike accidents in Île-de-France.edaJupyter compares severity rates across 14 factors such as helmet use, lighting, road type, weather and age.mlscikit-learn trains a severity classifier, tunes its threshold to catch at least 30% of severe accidents, and breaks down feature importance.
Real-world data is messy
Some of the problems I had to solve before any analysis could start:
- Two years of files were misspelled at the source (
carcteristiques-2021.csv), so a strict filename pattern silently dropped them. - A latitude column contained letters, which broke BigQuery's type detection. Everything now loads as text and is cast with custom dbt macros.
- Person IDs like
"203 851 184"contain spaces and turned into nulls when cast to numbers.
What the data says
- Helmet use is the key safety factor: the severe-accident rate is 6.7% without a helmet and 4.2% with one.
- Teenagers wear helmets the least.
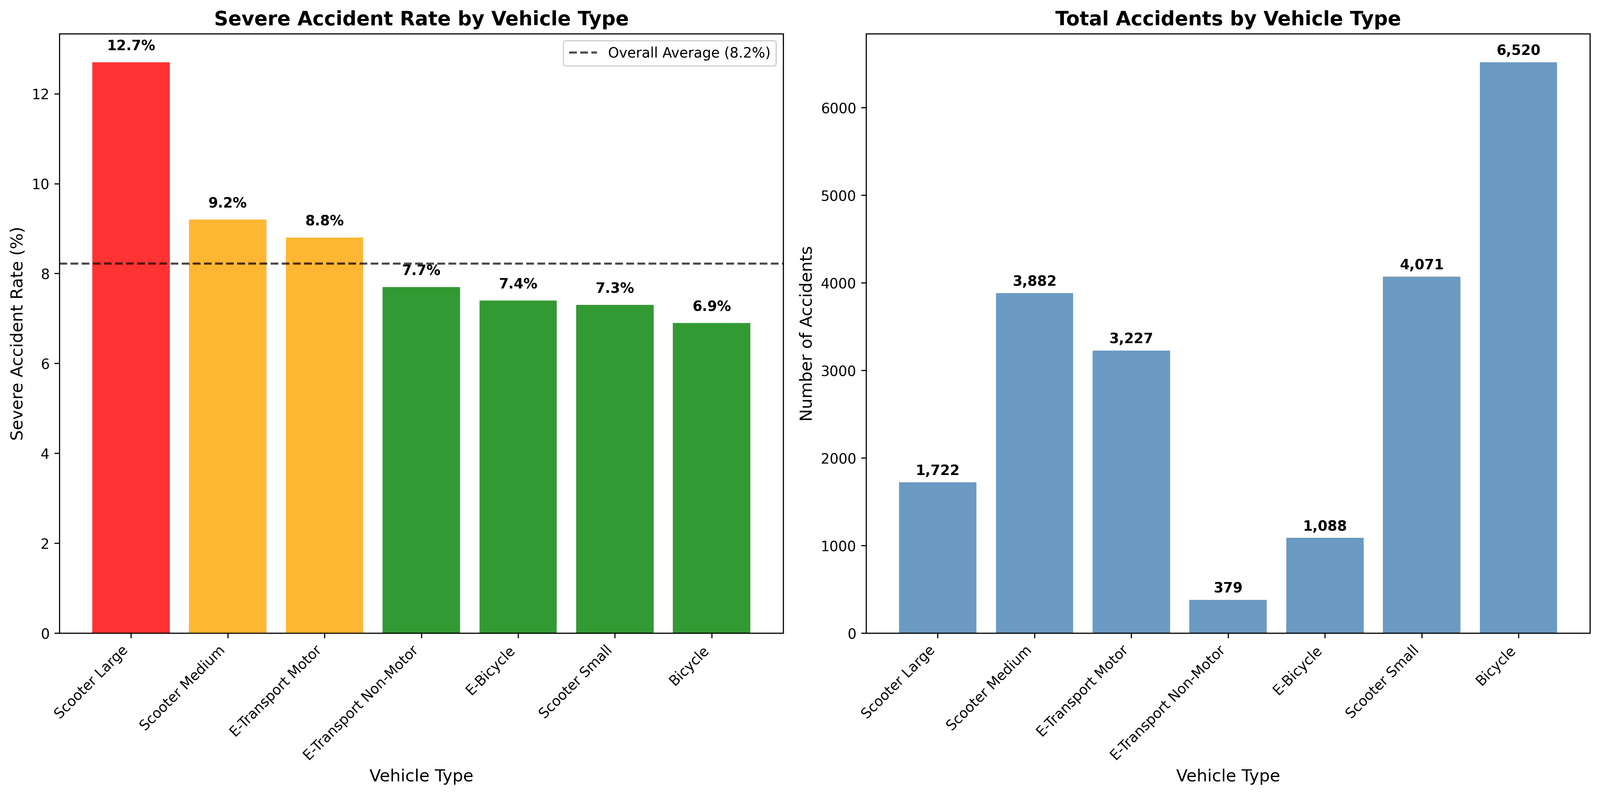
- Among micromobility vehicles, scooters lead to the most severe accidents.
From findings to policy
Laws alone don't do it: even in Finland, where helmets are mandatory, only 58% of cyclists wear one. Drawing on Nudge, I proposed light-touch interventions instead, such as making a helmet the default in bike subsidy programs and running peer-led campaigns for teenagers, modelled on Helsinki's “Pidä pääsi” (Keep Your Head Safe).
Where it started
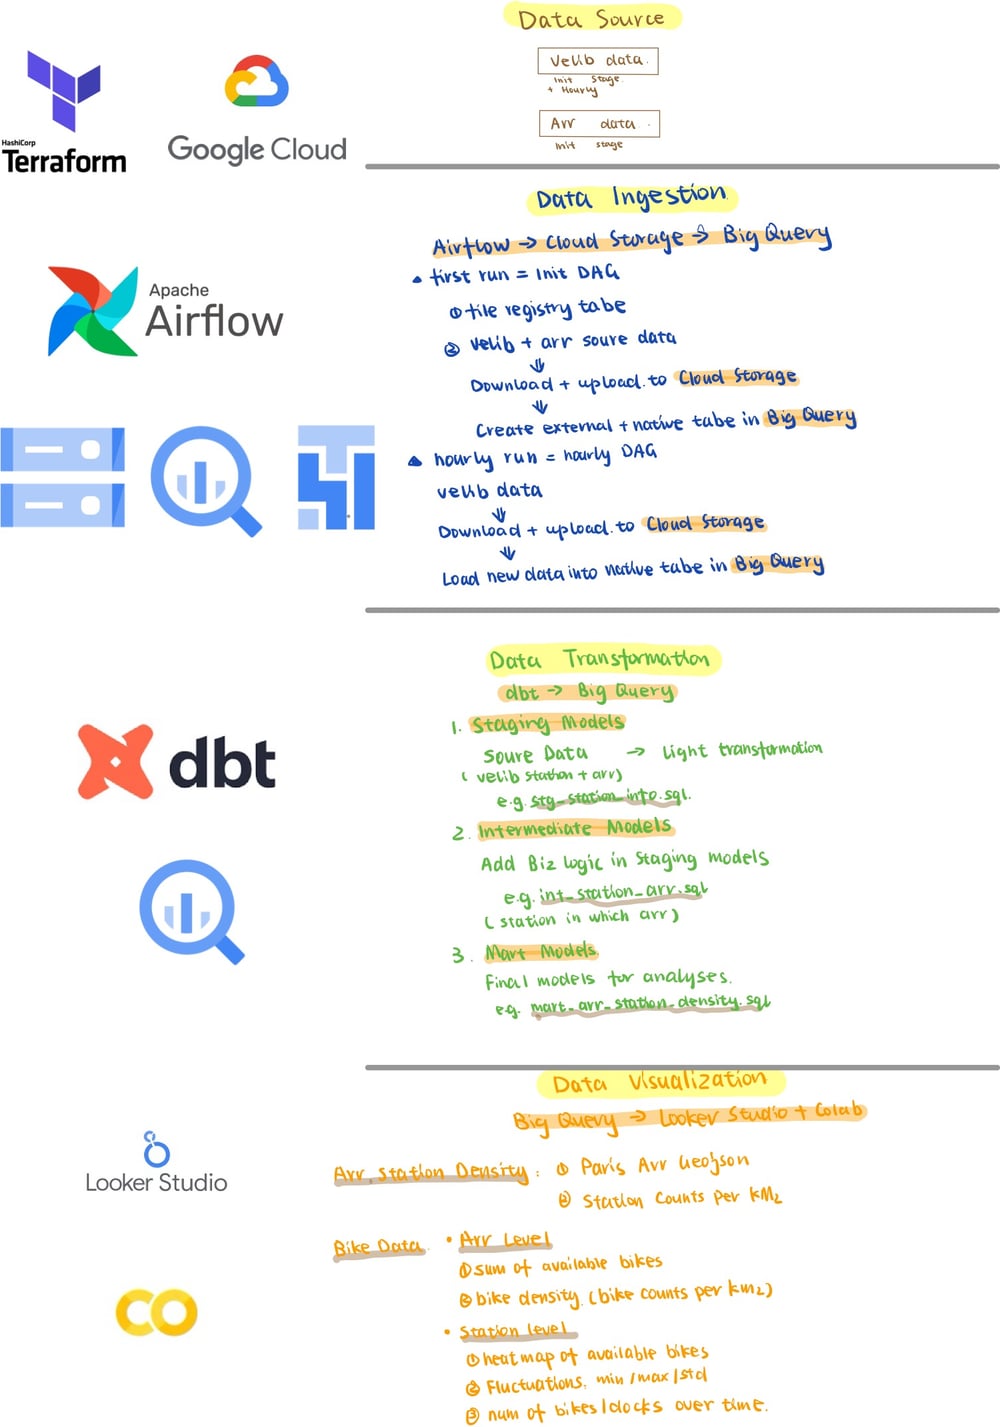
I built this as my master’s project on top of my earlier Paris bike-sharing project: an hourly pipeline for Paris's Vélib' bike-sharing data. Airflow pulled station snapshots every hour into Cloud Storage and BigQuery, dbt matched stations to arrondissements, and Looker Studio showed where bikes pile up and when.
It taught me two things that shaped the final version. Real-time bike data couldn't be joined with accident data that is only published once a year, so I changed the question. And people found the first version hard to set up, so the final project runs entirely in Docker.
How I learned the tools
I started this project with no data-engineering background. Each tool got its own beginner-friendly explainer with hand-drawn notes: the Data Engineering Components series on dbt, Docker, Terraform, Kubernetes and Kafka.